

BLOG
What is DataOps? Roles, Strategies, and Differences from DevOps


It might feel like DevOps is eating the world, but there’s still room for other innovations within and adjacent to IT operations. One such example is the DataOps movement. The general inspiration behind DataOps is similar to DevOps in that is strives to provide higher quality deliverables from shorter cycles by leveraging technology and specific methodologies around it.
DataOps does not boil down to DevOps principles applied to data analytics, however. While both approaches may embrace automation, continuous improvement, and strong communication between departments, DataOps is less of an infinite cycle and more of an injection of agility into a one-way data pipeline.
Let’s explore the roles, strategies, and technologies at play in a DataOps approach to analytics.
Going Agile in the Data Pipeline
Similar to DevOps sprints, DataOps seeks to bring agility to the data pipeline and replace the waterfall method with one in which data analysts can respond to business requirements and rapidly deliver insights accordingly.
When it comes to the infrastructure and any custom applications feeding into your data pipeline, DevOps practices should be used by your infrastructure, development, and operations teams in order to support data analysts and data platform managers. Where the DevOps and DataOps diverge is in the data pipeline itself, or the operational portion.
Operations must innovate by generating ideas for improvement which are informed by current business demand as well as through the actual processes and technologies available.
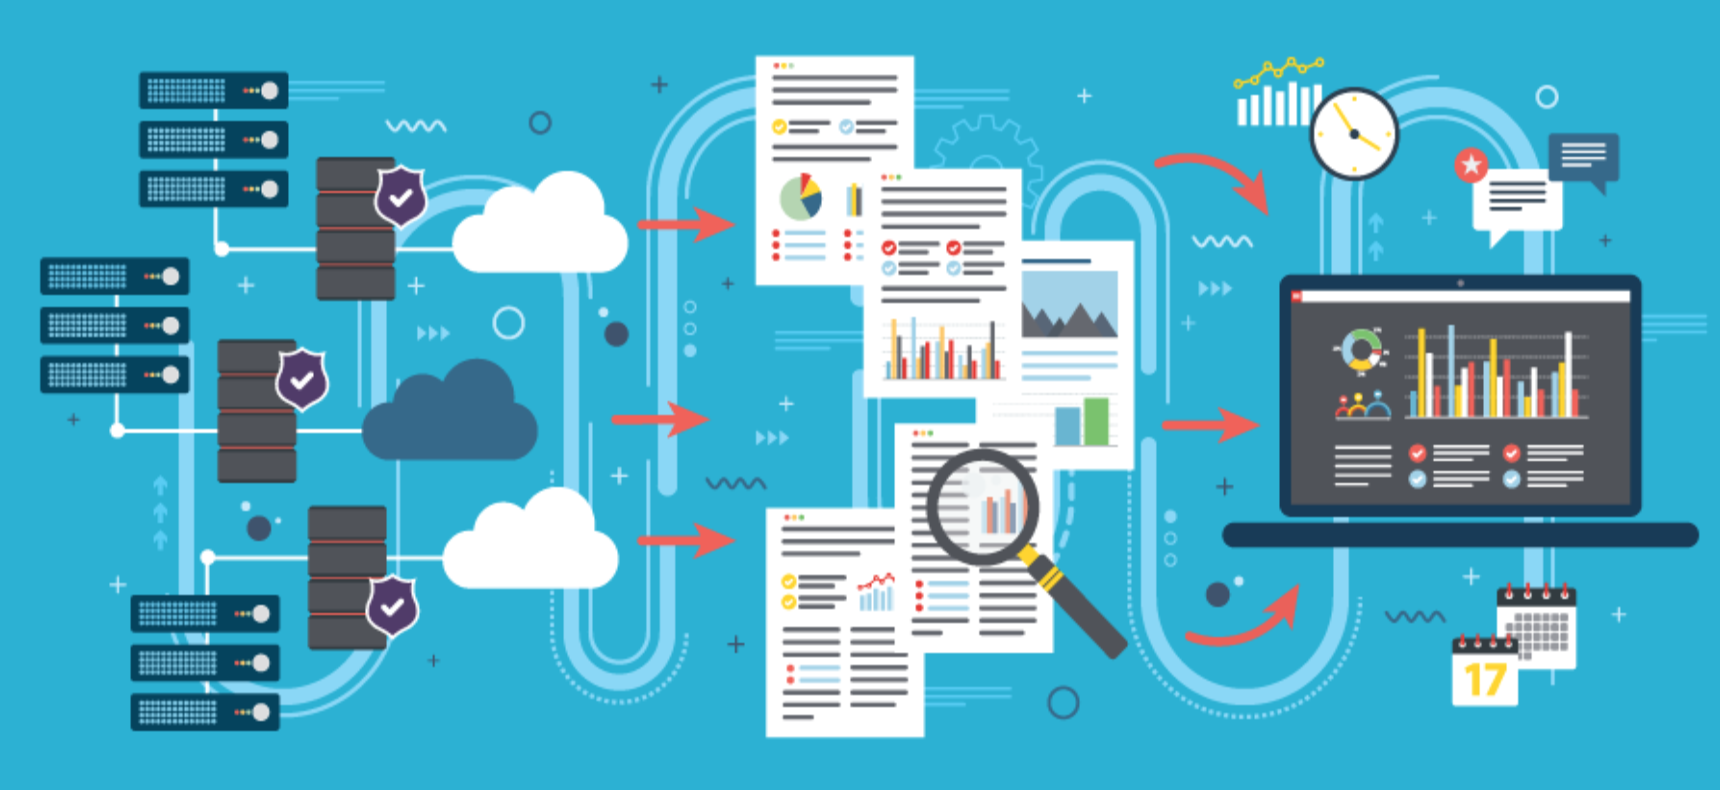
Data enters the pipeline from a wide array of sources throughout your organization. You’re likely familiar with various methods of importing data in Power BI, for example, from which it can be used to generate easily parsed dashboards and provide insights and comparisons.
Once it has entered the pipeline, data is subject to the various computing technologies in use throughout your stack. The areas those technologies intersect and interact with the data pipeline are updated and transformed over time with DataOps, creating and deploying new analytical modes and abilities within the pipeline.
DataOps strives to create and maintain automated methods of orchestrating your data platforms while also monitoring data quality and the status of related infrastructure – the machines powering your data analytics as well as the source of the data.
Within DataOps, as opposed to DevOps, you have steps to Orchestrate, Test, Deploy, and once again Orchestrate your various components. Orchestration might involve the creation of virtual machines or containers, various runtime processes based on the context of the data task at hand, data transfer and storage processes, and monitoring. Automated scanning of SQL or other databases helps to identify bad IDs or other parameters that may indicate junk or inaccurate data before it reaches your analytics platform. Automated infrastructure orchestration helps provision additional resources to handle a large influx of data.
As a whole, DataOps orchestration involves accessing the data from code or raw data sources, translating it into the data platform in use like SQL or ETL, modeling it, visualizing it, and finally generating reports.
Where to Test and Innovate in the Data Pipeline
If DataOps looks to inject innovation into the pipeline, it must do so in parallel to the production environment. That involves creating a large, multi-TB sample of your source data and pairing it with an automatically created development environment that includes a standardized set of software, infrastructure, and libraries.
The production data pipeline has fixed code but variable data entering from across your organization. The code itself is stable and has been tested and continually monitored. In the sandbox dev environment, the code is being actively changed, but the dataset is fixed, as you will be working with the representative data sample.
Just like DevOps, this innovation environment involves testing the code and platforms themselves rather than testing the data. While DataOps does include automated orchestration and monitoring of both the data platform and the data itself, this happens primarily within the production environment. You don’t need to clean up or catch errors in your sample data as it is simply there to create a fully functional sandbox for impact analysis. Code merges and data tests are brought together at the intersection of the live data pipeline and innovation cycle.
DataOps Roles and Responsibilities
DataOps uses many of the same data roles in place within your organization today, including data analysts, data scientists, engineers, architects, and developers.
The Development team is led by engineers, architects, and developers. The Operations side consists of analysts, scientists, the production infrastructure team, monitoring, and end-users or customers.
Benefits of DataOps
DataOps brings together your IT engineering and operations teams with the data analytics side of the business. It also brings together any satellite analytics teams with centralized management, as the best ideas from individual or far-flung teams can make their way into the innovation pipeline and get pushed into production after testing.
The ultimate goal of DataOps is to align business and user demands with production data analytics environments, providing the tools, infrastructure, and processes required to respond rapidly and automatically while still maintaining high quality data. By implementing DataOps you simplify the process required to build a highly configurable, comprehensive data system from sandbox environment to orchestration, testing, provisioning, monitoring, dashboards, and reporting. Through the reduction in manual tasks and increased agility, your analysts and data scientists can focus on innovation and providing real value from an ever-increasing data volume.


